Mastering Data Visualization: From Basic Charts to Interactive Dashboards
Week 2, Day 5: Advanced Visualization Techniques
Welcome to the final day of Week 2: Advanced Analytics and Visualization! Today, we’re diving into advanced visualization techniques that will take your data presentations to the next level. Whether you’re creating interactive dashboards, designing custom charts, or exploring cutting-edge tools, mastering these techniques will help you communicate insights more effectively and engage your audience like never before. Let’s get started!
Why Advanced Visualization Matters
Visualizations are the bridge between data and understanding. Advanced techniques allow you to:
Engage Your Audience: Interactive visuals keep users interested and involved.
Simplify Complexity: Make complex data easy to understand at a glance.
Unlock Insights: Reveal patterns and trends that static charts might miss.
Topics Covered
1. Interactive Dashboards
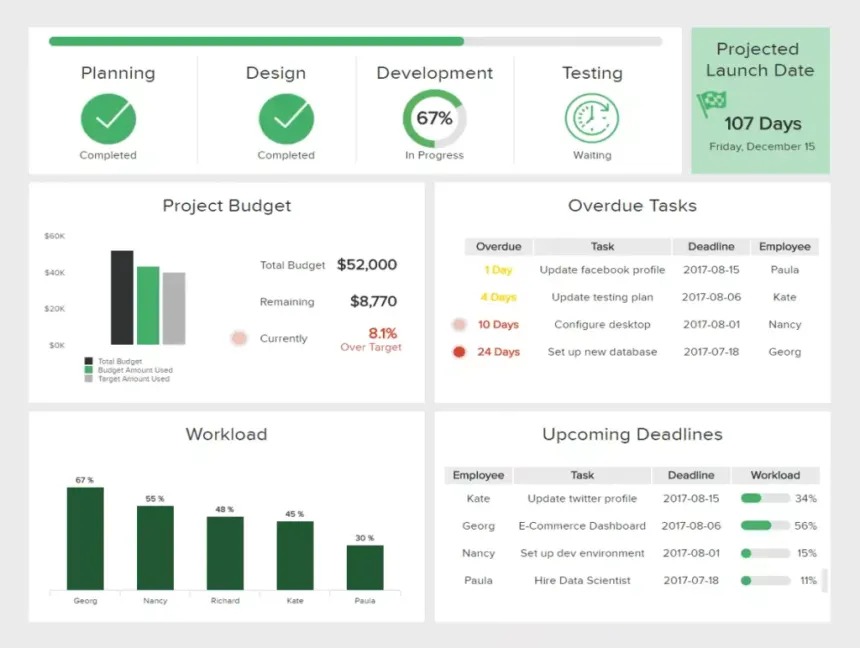
Interactive dashboards allow users to explore data dynamically by filtering, drilling down, and customizing views.
Tools for Interactive Dashboards
Power BI: Create dashboards with drag-and-drop functionality.
Tableau: Build interactive visualizations with ease.
Plotly: Use Python or R to create web-based dashboards.
Example:
Build a sales dashboard in Power BI with filters for region, product, and time period.
Add drill-throughs to explore detailed data.
2. Custom Visualizations
Sometimes, standard charts aren’t enough. Custom visualizations can help you tell a more compelling story.
Tools for Custom Visualizations
D3.js: A JavaScript library for creating custom, web-based visualizations.
Matplotlib and Seaborn: Python libraries for advanced static visualizations.
Flourish: A user-friendly tool for creating animated and interactive charts.
Example:
Use D3.js to create a network graph showing relationships between customers.
Use Flourish to build an animated bar chart race showing sales growth over time.
3. Geospatial Visualizations
Geospatial visualizations use maps to display data with a geographic component.
Tools for Geospatial Visualizations
Tableau: Create maps with built-in geographic data.
Plotly: Use Python to create interactive maps.
Leaflet: A JavaScript library for building custom maps.
Example:
Create a heatmap in Tableau showing sales density by region.
Use Plotly to build an interactive choropleth map showing population growth.
4. Storytelling with Visuals
Combine visuals with narrative to create a compelling data story.
Tools for Storytelling
PowerPoint: Create slides with a mix of visuals and text.
Canva: Design infographics and presentations.
Flourish: Embed interactive visuals in blogs or reports.
Example:
Use PowerPoint to present a data story with slides showing trends, insights, and recommendations.
Use Canva to design an infographic summarizing key findings.
Pro Tip: Use Color Wisely
Highlight Key Data: Use contrasting colors to draw attention to important insights.
Avoid Overloading: Stick to a simple color palette to avoid overwhelming your audience.
Consider Accessibility: Ensure your visuals are readable for colorblind users.
Practice Tasks
Task 1: Build an Interactive Dashboard
Use Power BI or Tableau to create a dashboard with filters and drill-throughs.
Share the dashboard with your team or on social media.
Task 2: Create a Custom Visualization
Use D3.js or Flourish to create a custom chart (e.g., network graph, bar chart race).
Embed the visualization in a blog post or report.
Task 3: Design a Geospatial Visualization
Use Tableau or Plotly to create a map showing geographic data.
Add interactivity (e.g., tooltips, zoom).
Key Takeaways
Interactive Dashboards: Engage users with dynamic, customizable views.
Custom Visualizations: Go beyond standard charts to tell a unique story.
Geospatial Visualizations: Use maps to highlight geographic trends.
Storytelling: Combine visuals with narrative for maximum impact.